What is the SpectralBridge spectral library?
Start with From spectra to ecological inference: the current evidence and reusable numerical methods, from difference to field validation.
A spectral library links wavelength-dependent reflectance to observations and their provenance. SpectralBridge reads a supplied polygon-extraction Parquet in place, preserves identities, and produces compact summaries rather than another pixel cache. Its original purpose remains reproducible NEON and drone processing and comparison across sensors and scales.
Three distinct scientific questions
The current primary validation separates separability, identifiability and abundance. Different category spectra do not guarantee accurate recognition; accurate recognition does not guarantee unique mixture fractions; synthetic fraction recovery does not establish field cover.
The versioned evidence packet contains the source-linked report, ten figure families, explicit requirement and hostile-review tables, and the four-level evidence ladder. Only the five recorded researcher cover categories are primary. The new same-candidate control is a material negative result: reducing NEON ridge to the exact 15 retained MESMA parents removes its original larger-library advantage. Independent field fraction truth and verified physical units/purity remain missing.
The numerical snapshot below is the preserved preceding companion, not the final word on intrinsic model superiority. New random-subset, PCA and consistent nested temporal controls are documented in the primary packet. These local results must be committed before the repository links are available on the published site.
From measurements to ecological questions
These are optional linked analyses, not mandatory pipeline stages. A researcher may stop at a corrected raster or a library summary. Sensor translation does not supply independent validation, and mixture readiness is a further research question.
What does one spectrum represent?
Pixels are reduced to wavelength-wise medians for each polygon/plant within a flight/source observation. Repeated observations receive equal weight when forming a plant or polygon/year median. Site and acquisition year come from source identities, not an unrelated folder date. Repeated years retain the same GlobalID; they are not independent new plants. Pixel counts affect precision and heterogeneity, but do not become biological replicate counts.
Metadata include source table/image, flight, polygon identity, GlobalID, species, cover labels and available site/year/shade annotations. Completeness varies; missing labels are retained as missing, not guessed. Read the class systems before grouping observations.
| Primary question | New polygon parents / identities | Held site |
|---|---|---|
| Full NEON five-category balanced accuracy | 85.2% | 73.8% |
| Synthetic OLI five-category balanced accuracy | 66.8% | 57.7% |
| Synthetic NEON fraction RMSE: MESMA | 0.359 | 0.362 |
| Synthetic NEON fraction RMSE: projected ridge | 0.216 | 0.269 |
Only recorded researcher cover categories define the current biological groups. Scores are conditional on sampled source labels and domains. Synthetic fractions are known algebraic weights, not independent field cover. Better regression does not establish unique physical inversion or operational abundance validity.
A view of the empirical library
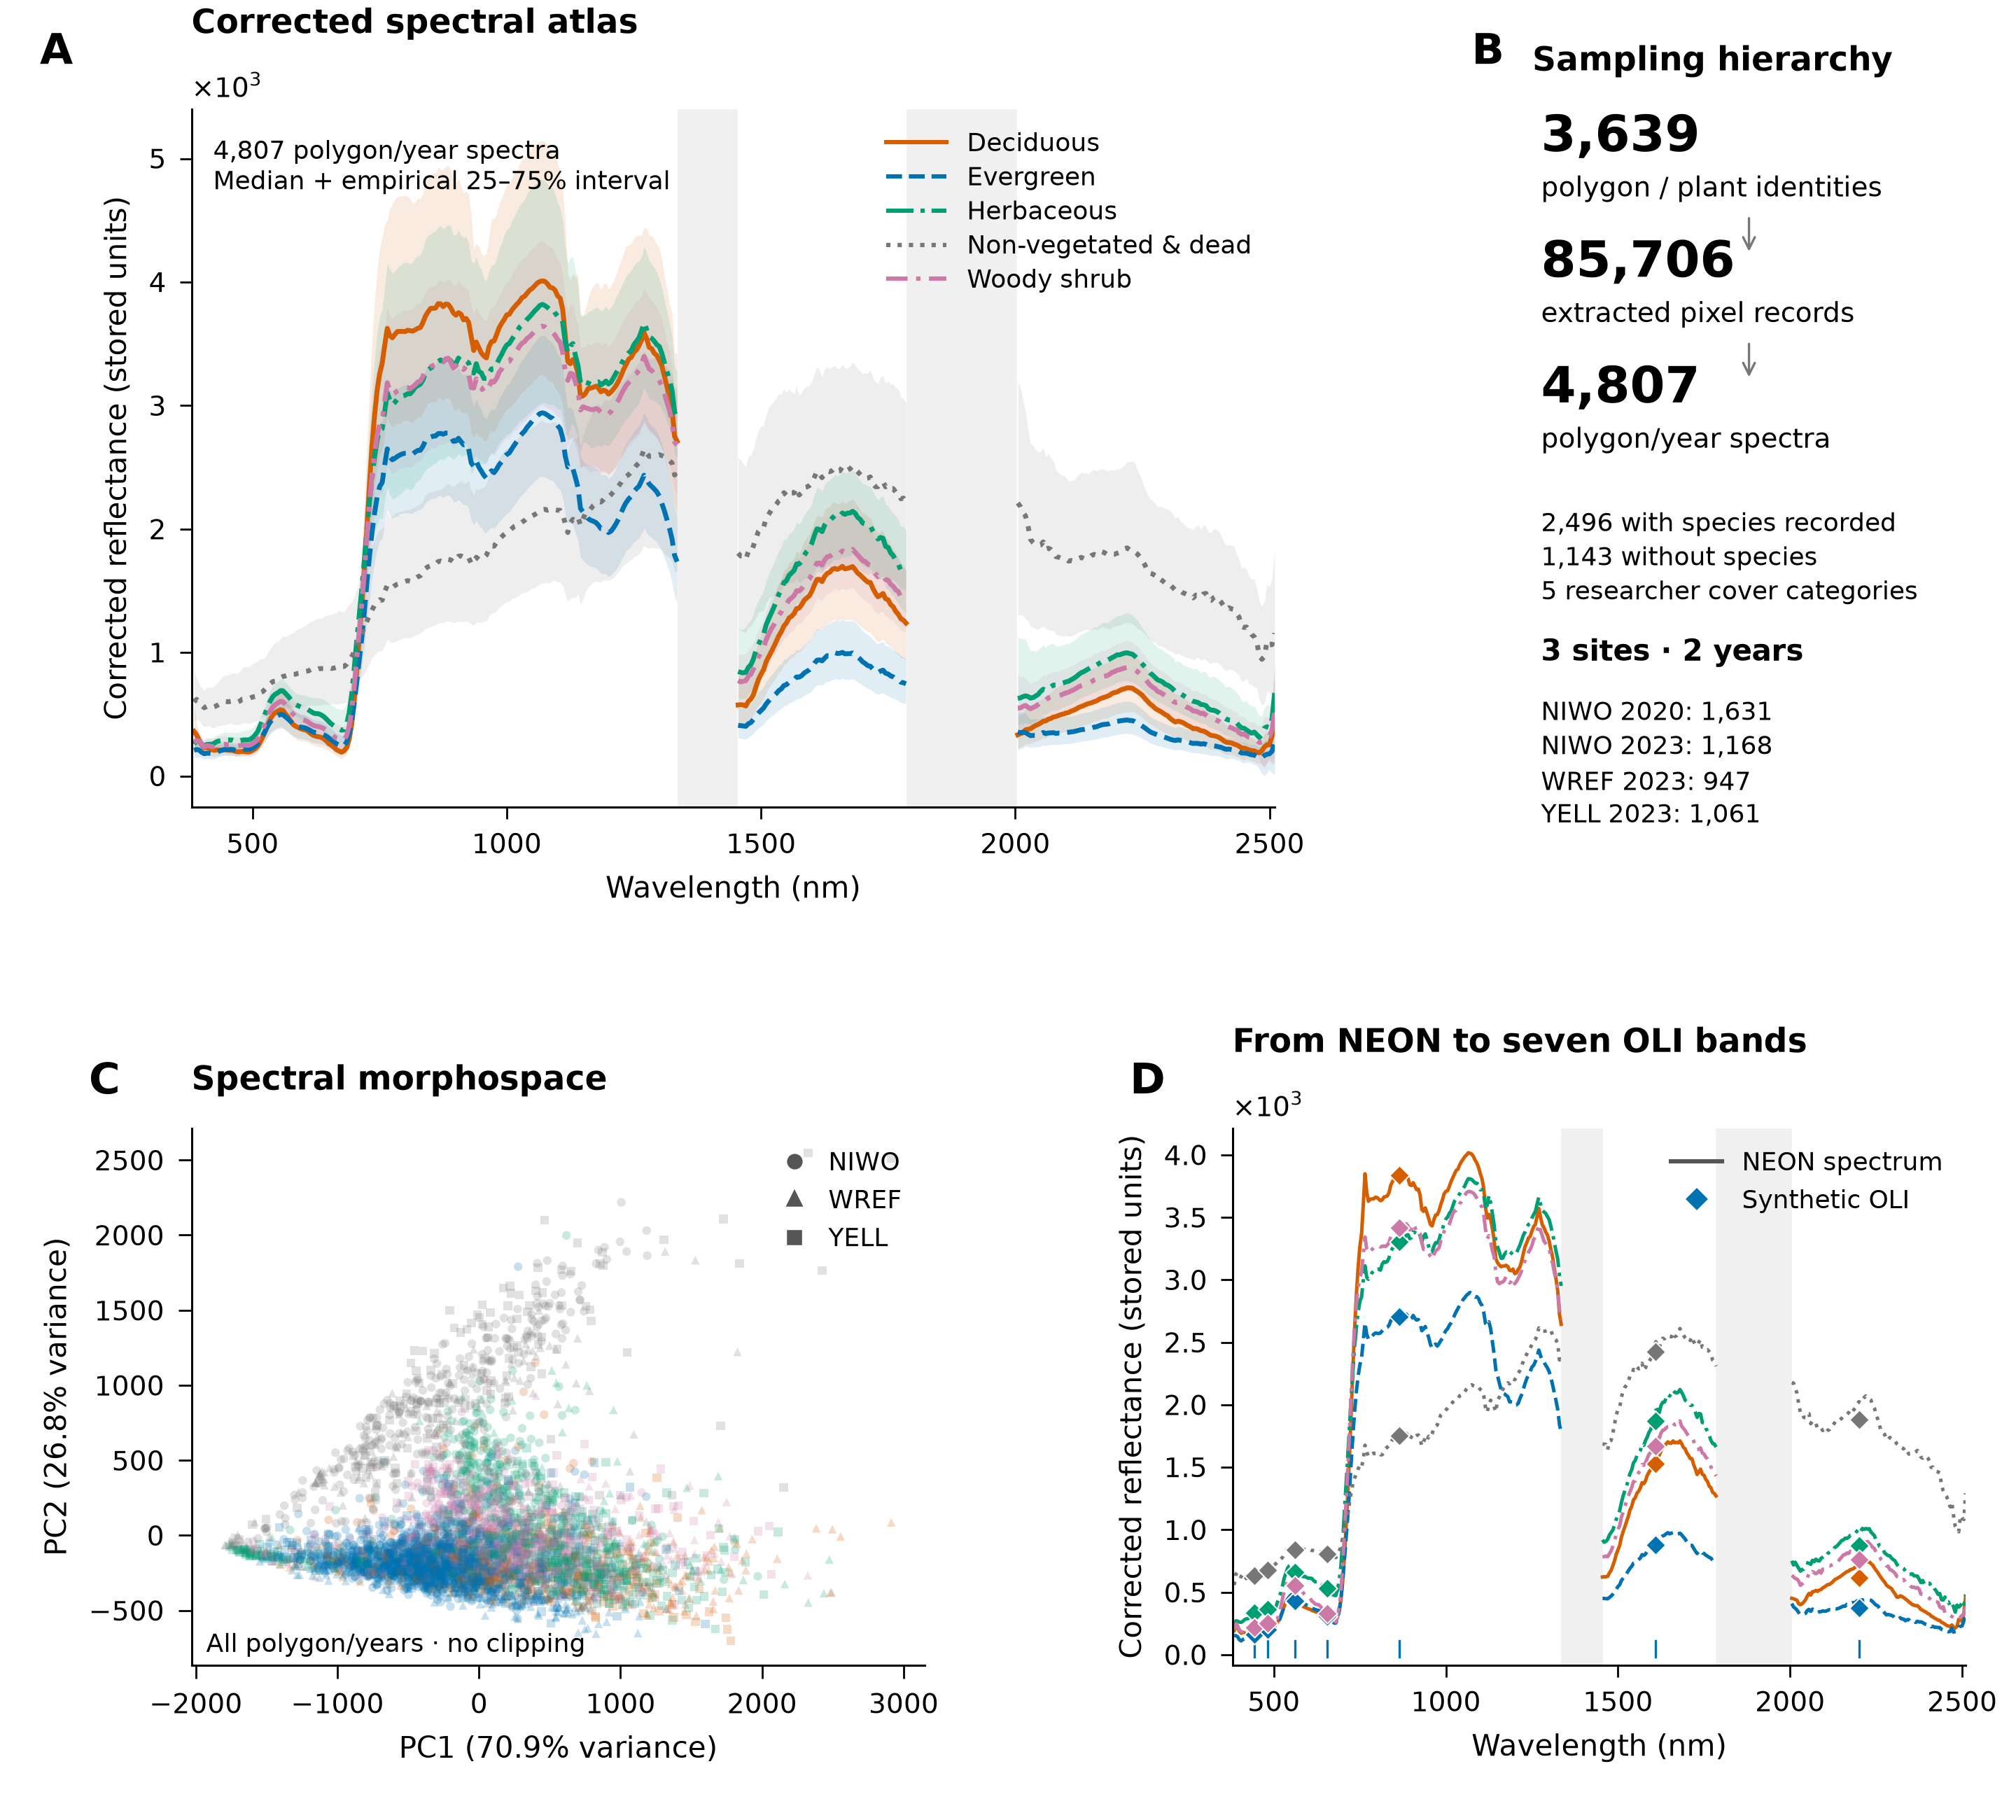
The supplied library contains substantial within-category variation and organized, overlapping spectral structure. Shading around category medians is the empirical 25–75% interval, not a confidence band. Atmospheric gaps stay disconnected. PCA includes every polygon/year observation; its first two axes explain 70.9% and 26.8% of wavelength-weighted variance. Diamonds show synthetic OLI values from the same observations. Library reflectance remains in stored units because absolute scaling is unresolved.
Open the atlas figure at full resolution · Figure methods and panel sources · Reproducible Python source · Numerical and visual validation
Choose an analysis
- Inspect an existing library: stable public preflight and compact summaries.
- Build an empirical atlas: native grids, atmospheric gaps, site/year aggregation and variability.
- Ask whether groups differ: conditional whole-spectrum comparisons and their limits.
- Check sensor information retention: paired NEON versus synthetic OLI.
- Compare with real Landsat: a separate, single next-day pilot.
- Assess mixture readiness: experimental endmember and fraction diagnostics.
These results support questions about the sampled library. They do not establish novel-species classification, regional abundance maps, causal PFT mechanisms or universal sensor calibration. See evidence levels and the API maturity map.
Canonical researcher-category information and abundance analysis
The five recorded researcher categories are the sole primary biological groups. The versioned analysis locates wavelength-level discrimination, evaluates complementary measurements with nested group validation, and compares supervised fraction models with constrained linear/MESMA baselines on identical synthetic mixtures. Earlier dual-label summaries are historical, not the current final interpretation. See the label policy and researcher-category evidence packet.
Keep valid repeat observations with identity/site/year/acquisition/annotation metadata. Hold complete histories together in validation. Conditional spectral recognition, synthetic mixing-weight recovery and independent field abundance remain distinct levels of evidence.